Price Movements: The price of SOL, Solana's native cryptocurrency, barely budged last week after a hack drained thousands of wallets.
Market Liquidity: Ukrainian hryvnia-denominated crypto volume remains robust, with the majority of trades now placed for the stablecoin Tether.
Derivatives: ETH option volumes have surged ahead of the Merge, with investors piling into the $3k strike.
Macro Trends: Bitcoin's rolling correlation with both bonds and Nasdaq hit a 3-month low, suggesting crypto markets have diverged from traditional assets.
Nomad Bridge exploit leads to unusual activity on Uniswap V2.
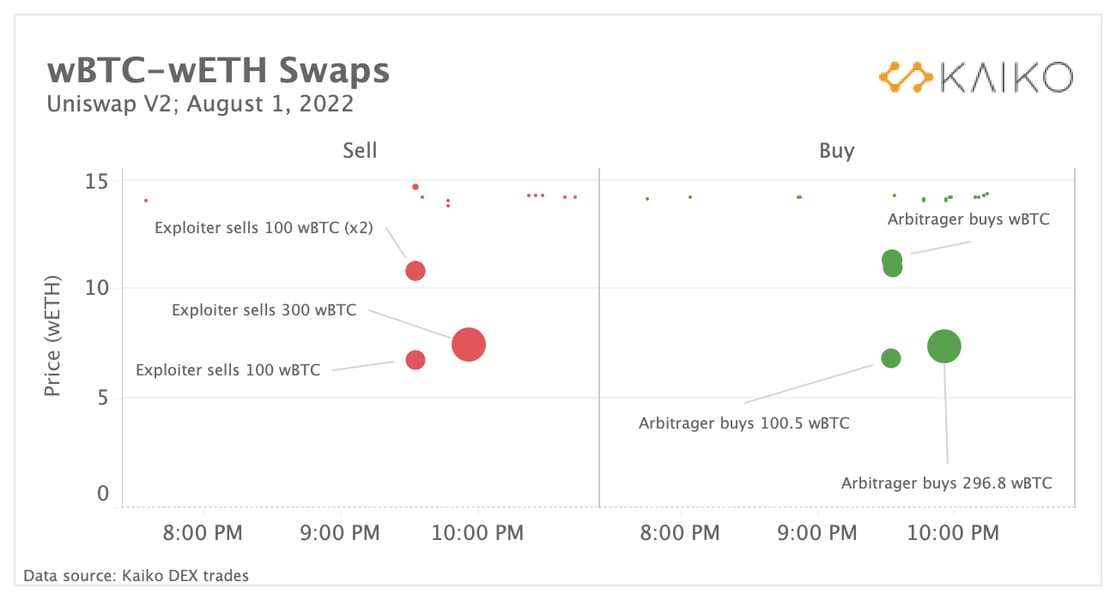
Nomad, which connects Ethereum, Avalanche, Moonbeam, Evmos, and Milkomeda C1, was the latest bridge to suffer an exploit in what has been a concerning trend over the past year. This exploit was unique in that a large number of wallets were able to drain the bridge, ultimately siphoning nearly all of the $190mn worth of crypto assets that were locked. When examining the transactions that started the exploit, Kaiko Research discovered that the exploiter(s) quickly swapped 600 stolen wBTC on Uniswap V2, incurring huge amounts of slippage.
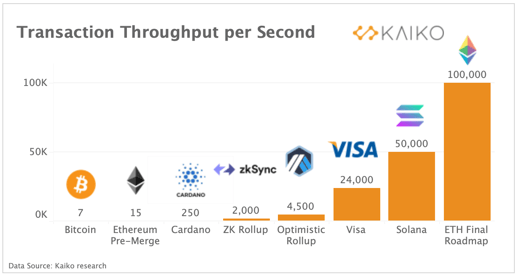
In the largest transaction, the attacker lost over $3mn in slippage. Had the attacker used Uniswap V3, they likely would have faced slippage around 1% and there would have been limited arbitrage opportunities. We can view the four individual swaps on V2 totalling 600 wBTC, which tanked the price and triggered instant buys by arbitrage bots.
It thus remains a mystery as to why they opted to use Uniswap V2, when Uniswap V3 is nearly 20x more liquid. Uniswap V2’s wBTC-wETH pool has the equivalent of just over $15mn in total liquidity, whereas V3's largest wBTC-wETH pool has $270mn of liquidity. For example, in one transaction a bot was able to swap 684 ETH for 100 wBTC for 1,416 ETH, netting a huge profit.
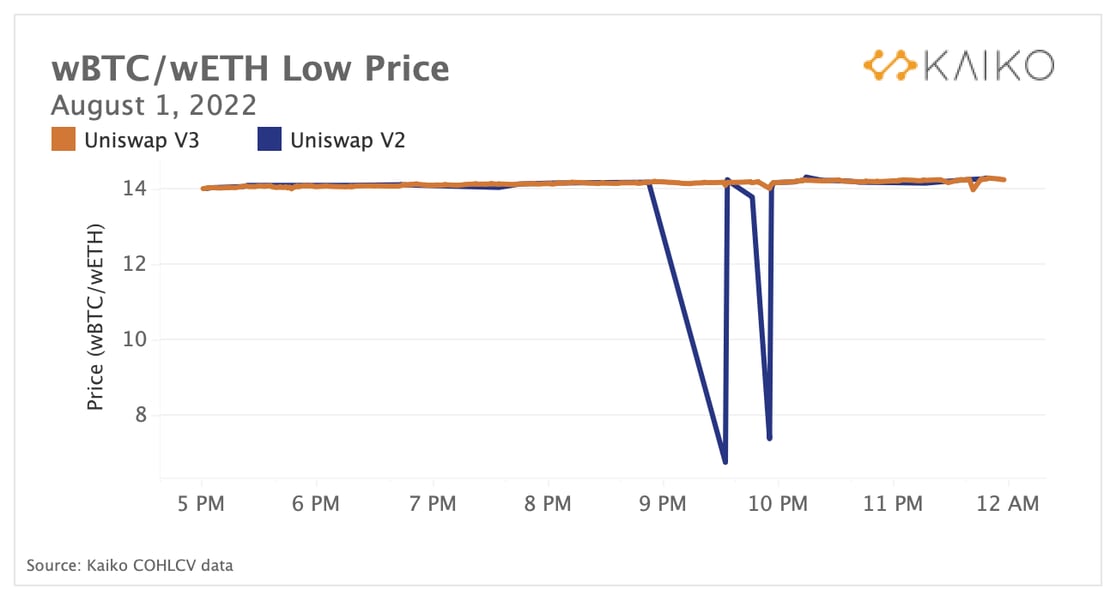
The price of wBTC in terms of wETH on Uniswap V2 was cut in half during each of these transactions, which we can observe in the price feed for the V2 pool:
The question thus remains: why Uniswap V2? Check out our full analysis where we run through several theories and further explore this bizarre series of transactions.
Markets are resilient despite a week full of hacks.
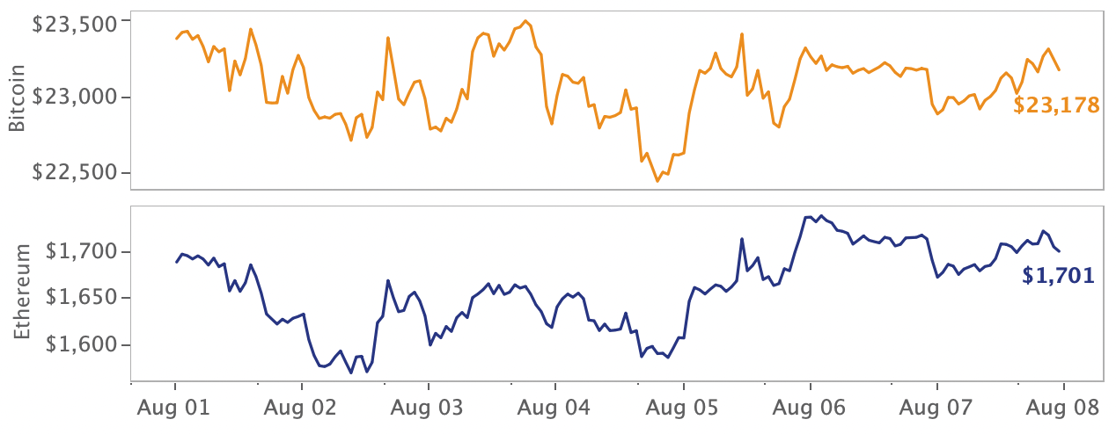
Crypto markets barely suffered a dent despite another round of hacks causing millions in losses. The Nomad bridge has recovered just $22mn of $190mn stolen while the thousands of Solana wallets that were drained by an unknown attacker will likely have very limited recourse. Bitcoin traded just above $24k as of Monday morning and ether continues to outperform the markets, up more than 10% over the past week. The luxury fashion world further embraced of NFTs this week, Gucci announcing they would accept Apecoin as payment and Tiffany's releaseing a custom CryptoPunk jewellery line.
On the macro front, Friday's U.S. jobs report revealed a very strong labor market with the unemployment rate now sitting at a half-century low, which could make it harder for the Fed to slow down the pace of rate increases at their next meeting, scheduled for September.
A wild week for Solana ecosystem has negligible price impact.
Last week, the Solana ecosystem suffered a whirlwind of bad news. Just hours after the Nomad exploit, thousands of Solana wallets were mysteriously drained of ~$8mn in funds, an event that shocked the ecosystem. Solana engineers came to the conclusion that mobile wallets were the source of the hack, and some have speculated that user private keys were inadvertently exposed. Interestingly, the hack had a negligible impact on the price of SOL or other top Solana ecosystem tokens like Serum, charted above.
The next day, CoinDesk published an investigative article alleging that a single developer responsible for Solana’s Saber Protocol had contributed to protocols using 11 different pseudonyms. At their peak, the protocols he created comprised the majority of Solana’s Total Value Locked. The article also noted that the developer is planning to move to Aptos, the blockchain run by former Facebook employees that recently raised $150mn. Saber’s SBR token shot up over 100% in late July as rumors spread that it would be expanding to Aptos but following the CoinDesk exposé, the price returned to its pre-rumor level.
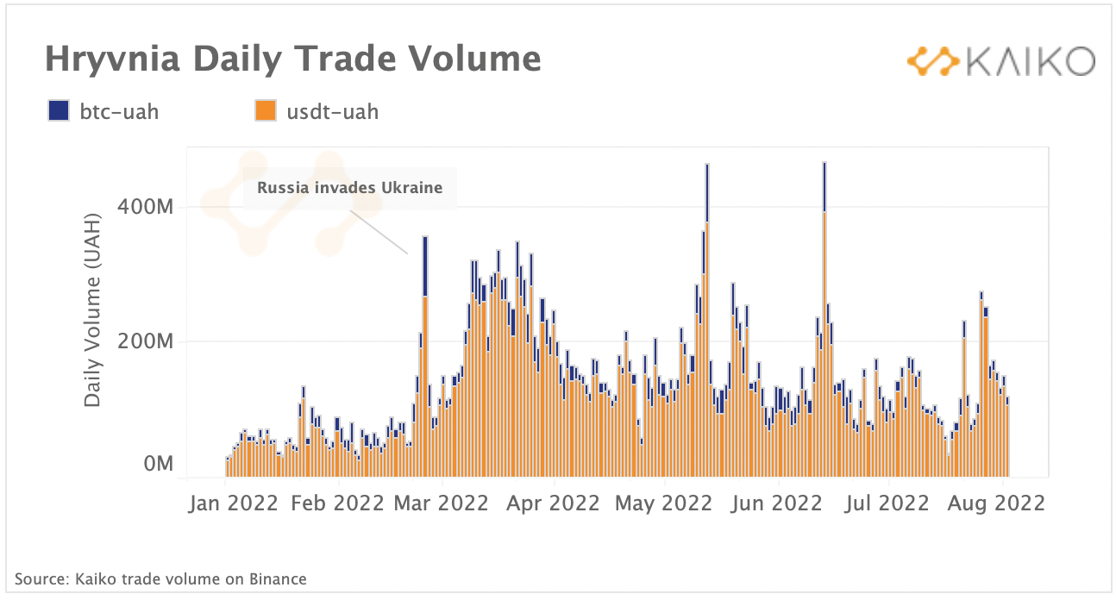
More than six months after the start of Russia’s invasion of Ukraine, Ukrainian hryvnia (UAH) cryptocurrency trade volumes remain robust. This suggests strong local demand despite the Ukrainian central bank banning crypto transactions in the local UAH currency in April, in an attempt to reduce currency outflows.
BTC-UAH and USDT-UAH weekly volume spiked on Binance after the start of the war and has been hovering between 100-200mn UAH daily (~$3-5mn) ever since. The increase was mainly driven by rising transactions for the stablecoin Tether, which tripled on average since January, rising faster than BTC trades. Today, the majority of UAH-denominated trades are for Tether, which suggests the stablecoin is in demand as the local currency experiences a strong devaluation and FX market disruptions.
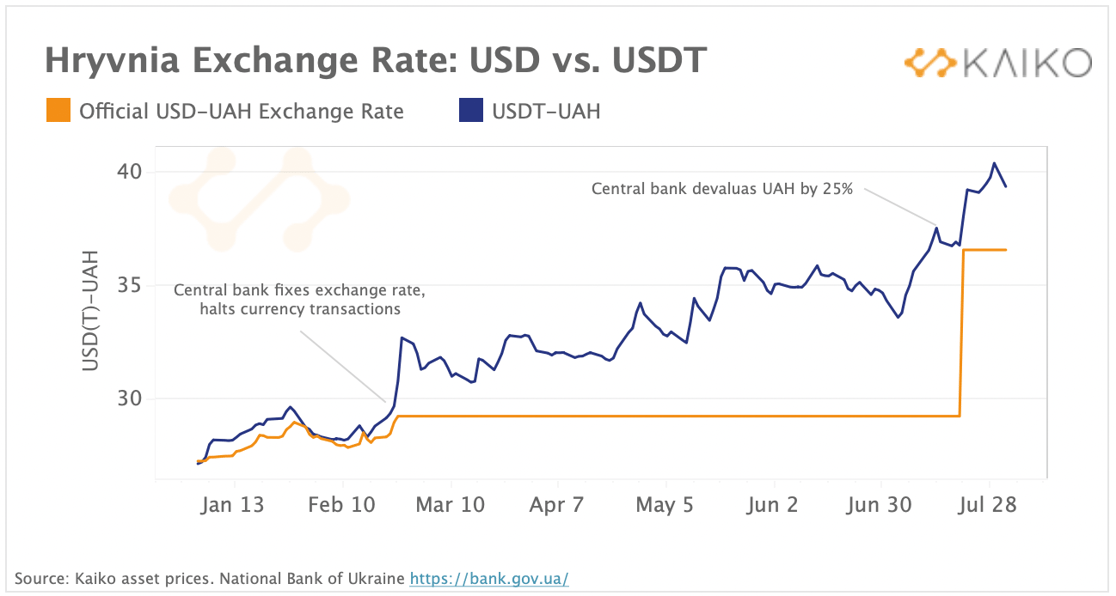
Since the start of the war the Ukrainian central bank (NBU) has kept the hryvnia exchange rate against the US Dollar fixed to limit inflation and stabilize the country’s financial system. Crypto markets, however, have continued operating, which provides a fascinating case study showing how decentralized markets can enable price discovery despite government restrictions. The price of the USD-pegged stablecoin Tether expressed in UAH has surged by nearly 40% since the end of February, suggesting the hryvnia has continued losing its value against the US Dollar, even though the official central bank exchange rate did not budge.
Only last week did the NBU announce a new exchange rate for UAH, fixing 1 USD at 36 UAH, a 25% increase. Meanwhile, the price of 1 USDT continues to diverge on crypto markets.
Bitcoin price slippage remains elevated amid high volatility.
The year’s two large volatility events, the Terra collapse and crypto credit crisis, had large effects on bitcoin slippage across all exchanges. Examining slippage for a simulated $100k market sell order, the Terra crash created a sharp spike and quick return to normal for most exchanges. The Celsius collapse and unraveling credit crisis created a spike that was not as quick to subside, and slippage for BTC-USD pairs on most exchanges remains at elevated levels, suggesting market makers remain cautious.
The good news is that in recent weeks slippage has trended back down, suggesting that liquidity is returning to exchanges as there is less forced selling and volatility. Barring any significant news events, we would expect to see this trend continue and slippage return to pre-Terra crash levels.
Derivatives
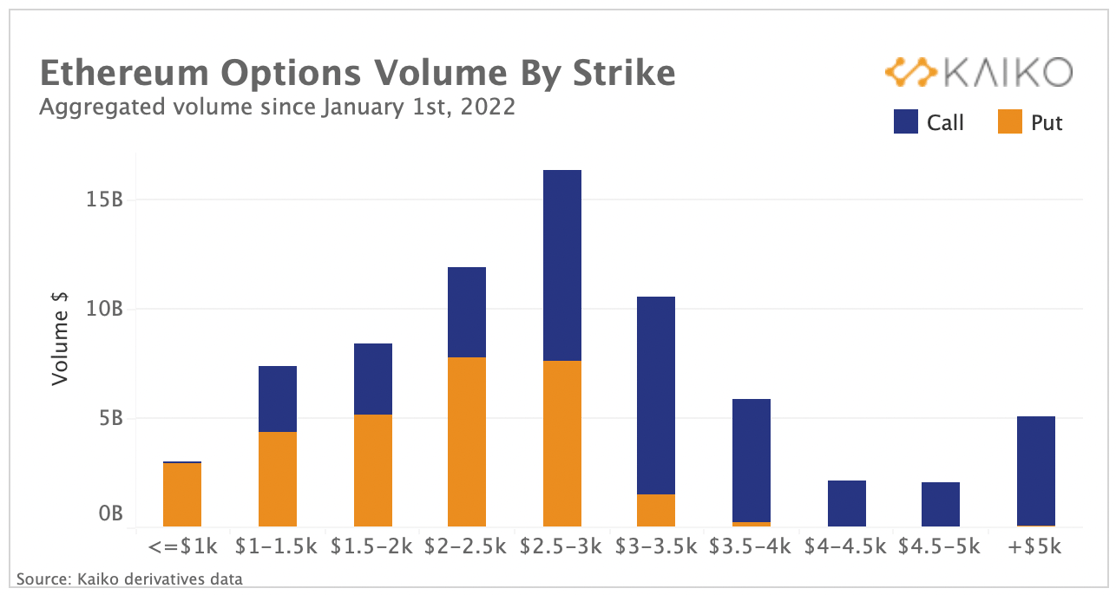
ETH options volume spikes at $3k strike.
Ahead of the Merge, ETH options activity has surged, with open interest surpassing BTC options for the first time ever. Since January 1st this year, ETH option investors are piling into the $2.5-3k strike price range on both the call and put side with nearly $15bn of volume on that range alone. Interestingly, this is the first range we observed that call volume overtook put volume, and it appears to be a pivotal price point for ETH investors ahead of the Merge. After the $3,000 strike price, call options dominate put options by volume as investors look to partake in the upside offered by calls after this range. We observed the importance of mental price figures for option investors at round numbers above the current price: $3k, $2.5k, $2k, were the top 3 strikes in terms of volume traded.
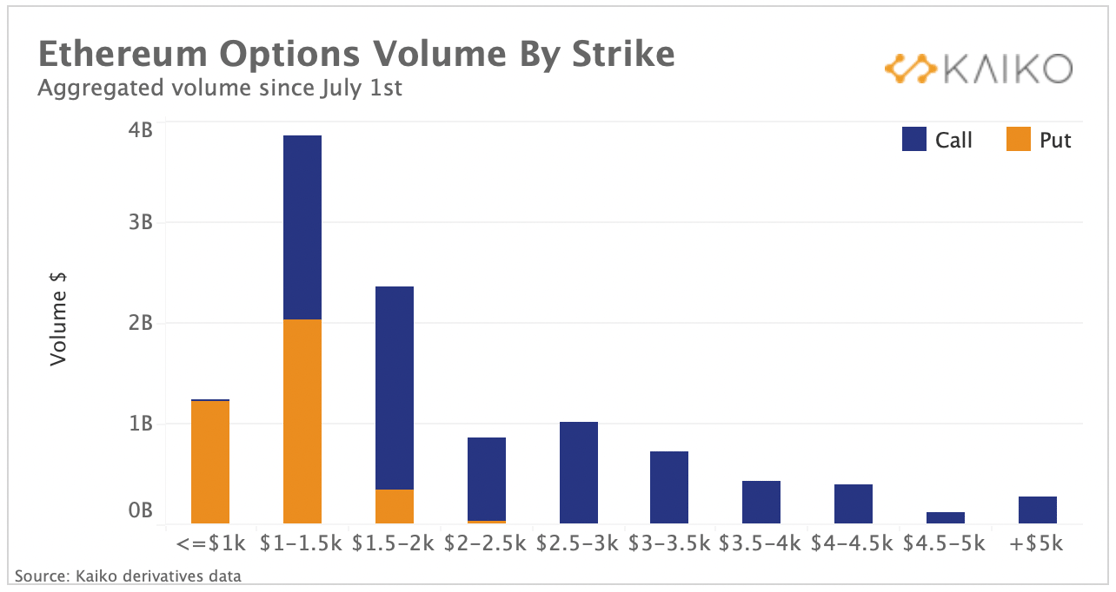
As we get closer to the Merge in September, the $1-1.5k range is garnering the most attention from option investors since July 1st, with put volumes in that price range outnumbering call volumes. Put buyers in this range are investors either looking to hedge their exposure ahead of the Merge or simply bet against ETH with the potential for negative price action if the Merge is delayed or unsuccessful. After the $1.5k range the vast majority of volumes traded are call options, despite ETH sitting near the $1,500 range or above since mid July.
Macro Trends
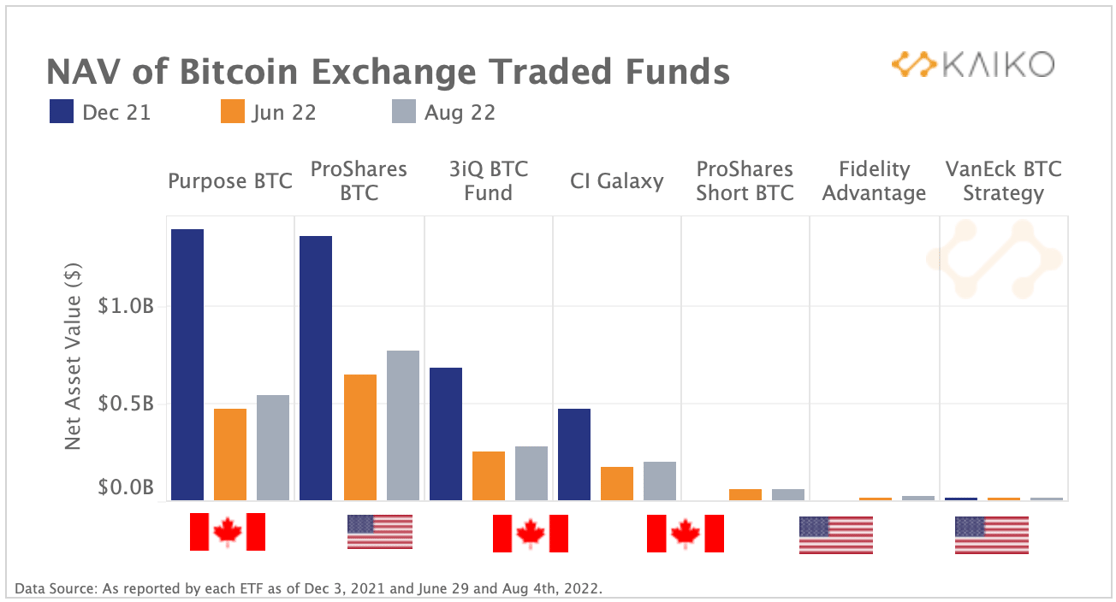
Slight inflows into BTC exchange-traded products.
Bitcoin spot and future ETFs have registered an increase in their assets under management since end-June. The trend could be explained by a recovery in bitcoin spot prices. However, it could also suggest some recovery in risk appetite and repositioning after investors aggressively de-risked their portfolios. While BetaPro Inverse Bitcoin ETF (BITI), which provides short exposure to Bitcoin, saw massive inflows in the days after its launch in early July, the trend has since slowed significantly. BITI’s assets under management are up only 2% between June 29th and Aug 4th versus a 15% spike in Bitcoin’s spot prices over the same period. By contrast, the smallest and cheapest ETFs - VanEck Bitcoin Strategy and Fidelity Advantage Bitcoin have seen their assets under management increase the most by 24% and 50% respectively.
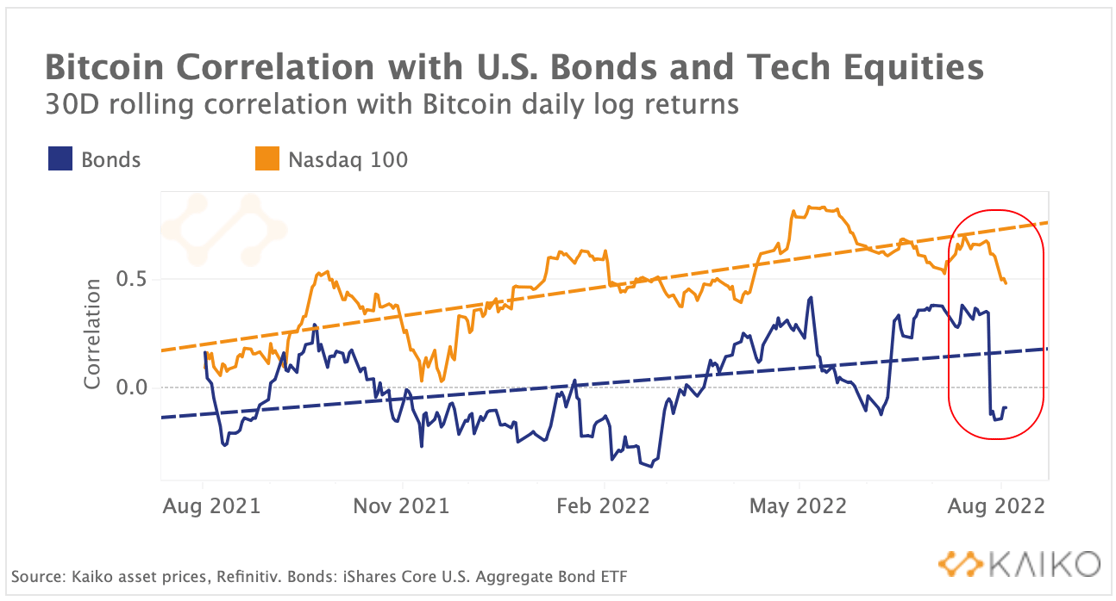
BTC's correlation with bonds and equities hits 3-month low.
Bitcoin’s 30-days rolling correlation with the aggregate bond index (AGG) and the tech-heavy Nasdaq 100 has declined to a three-months low over the past few weeks suggesting that idiosyncratic variables are increasingly playing a role in Bitcoin’s price action. Both stocks and bonds saw unusually large declines since the start of 2022, leading to historically low returns of one of the most common forms of diversified investments – the 60/40 portfolio. Over the same period bitcoin lost 70% of its value, moving in sync with global risk sentiment. However, the collapse of Terra’s ecosystem followed by some of the industry’s largest companies has caused a divergence, which appears to persist as markets are looking for direction.
Kaiko's research newsletter is written by the Kaiko research team: Clara Medalie, Dessislava Aubert, Riyad Carey, and Conor Ryder, CFA. This content is the property of Kaiko, its affiliates and licensors. Any use, reproduction or distribution is permitted only if ownership and source are expressly attributed to Kaiko. This content is for informational purposes only, does not constitute investment advice, and is not intended as an offer or solicitation for the purchase or sale of any financial instrument. For any questions, please email research@kaiko.com.


-3.png?upscale=true&width=1116&upscale=true&name=image%20(7)-3.png)
-4.png?upscale=true&width=1116&upscale=true&name=image%20(7)-4.png)