Welcome to the Data Debrief! BTC traded above $35k this morning after remaining rangebound for much of the past two weeks. Meanwhile, PayPal faces a subpoena from the SEC over its new stablecoin, SBF was found guilty on all seven criminal fraud counts, and the new Celestia blockchain is off to a slow start. This week we explore:
Solana's rally, one year post-FTX collapse
The persistence of the Alameda Gap
A mysterious Zcash premium on Yobit
Bitcoin is trading at 18-month highs. What changed? Next Tuesday, join the Kaiko Research team for a deep dive into the latest market rally, exploring trends in trade volume, liquidity, altcoins, and correlations with traditional assets. It has been a tough year for crypto markets. Could this be the start of the next bull run?
Solana has once again captured the limelight, rallying from $21 in mid-October to nearly $45 last week. Following the collapse of FTX, SOL briefly traded at under $10. SOL’s price gains have been partly driven by surging activity on the network, especially in liquid staking token protocols like Jito.
As an “alt L1”, SOL is often compared to ETH, and since September SOL has been the clear outperformer, with the ratio between the two jumping from 0.011 to nearly 0.025, breaking the ratio from just before FTX’s collapse.
Net buying has been led by Coinbase, with a net of 2.2mn tokens market purchased since October 18, the start of the rally. Binance trailed Coinbase until the start of November, when market buying quickly accelerated, ultimately reaching a cumulative volume delta (CVD) of 1.9mn since October 18.
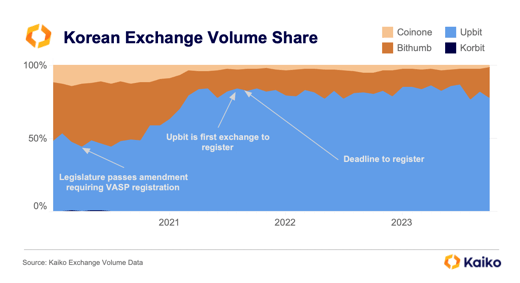
Meanwhile, Korea’s top exchange – Upbit – has bucked the trend, market selling a net of nearly 4mn SOL tokens. As discussed in last week’s Deep Dive, the Korean market is quite different from other markets.
SOL topped the list of the most traded altcoins on US-available exchanges this year, outpacing DOGE, LTC, MATIC and XRP.
Overall, what started as a tough year for altcoins in the U.S. has improved significantly in the past month.
Data Points
The Alameda Gap persists, one year post-FTX.
Although bitcoin rallied more than 20% in October, the “Alameda gap” — the sharp decline in order book liquidity we observed after the collapse of FTX and its sister company Alameda Research — has persisted. The 2% market depth for BTC, ETH and altcoins on centralized exchanges hovered at $800mn as of last week, still 55% below its pre-FTX levels.
While this is partly due to the low volume/low volatility environment which has kept both advanced traders and liquidity providers out of the market, there are also structural reasons — i.e. market makers leaving the space after sustaining losses or permanently revising their risk management strategies after FTX. For a refresher, check out our detailed analysis of the impact of the FTX collapse, written last November.
Government exhibit provides insight into Alameda’s market manipulation.
The prosecution in the case against SBF presented an exhibit showing Signal messages in which SBF directed Caroline Ellison, head of Alameda Research, to begin increasing the pace of buying of MAPS and OXY to pump their price. The messages were sent on January 24, 2022, with Ellison stating that the trading firm had purchased about $400k each of the two tokens in the previous five days.
As the chart shows, much of this volume came on Solana DEXes, as there was just about $1mn total volume for the two tokens on FTX in that timeframe. However, shortly after Ellison confirmed that Alameda would increase its TWAP purchases, the volume (and price) of both tokens began to skyrocket, especially MAPS’ volume, registering about $1mn in volume in two days.
Need a reliable price for Bitcoin? Our new live dashboard provides real-time updates for all Kaiko Rates and Indices, covering the top digital assets. Our BMR-compliant pricing services empower financial product issuers and investment professionals with trusted benchmarks for digital assets. Learn more here.
The second largest privacy coin by market cap — Zcash (ZEC) — has been trading at a persistent premium on Russian exchange Yobit throughout most of 2023. The ZEC-BTC price ratio was at times more than 30% higher relative to other exchanges such as Coinbase and Gemini.
The ZEC-BTC trading pair happens to be the second highest volume pair on Yobit, which is unusual considering the token ranks 84th in terms of global trading volume.
While ZEC has been trading at a premium since June 2022 on Yobit, the premium widened significantly this year and lasted for nearly seven months between February and August. It re-emerged in October and currently hovers at around 9%.
ZEC trade volumes on the exchange have been persistent despite dropping on other exchanges, with Yobit facilitating around $600mn in October, up from $400mn a year ago. Nearly all of the trade volume in October was on the buy side. Overall, Yobit’s market share of ZEC volume surged from around 30% in early 2022 to around 80% as of October 2023.
Privacy coins are designed to obscure transaction details, making them difficult to track. This has led some exchanges, such as Korean exchanges and HTX, to delist them due to rising regulatory pressures. In February, Dubai, tightened its stance towards privacy coins banning their use. The European Banking Authority also issued a draft guidance warning privacy coin users back in May.
Coinbase market share stagnates.
Coinbase, the largest U.S. exchange by market share, has failed to benefit from the demise of Binance.US, with its market share oscillating around 55% since May. Meanwhile, Kraken's market share has risen from 18% to 26% while smaller exchanges like LMAX Digital and Bitstamp have also taken some market share.
Coinbase’s Q3 quarterly report last week showed declining revenue and profit relative to the previous quarter. The exchange has been pushing ahead with its international expansion and derivative offerings in search for additional revenue streams.
Bitcoin's correlation with equities is falling.
Bitcoin’s correlation with traditional assets has weakened meaningfully this year, boosting its appeal as portfolio diversifier. Its 60-day correlation with the Nasdaq 100 fell from more than 70% in September 2022 to just around 19% as of last week. BTC’s negative correlation to the U.S. dollar has also weakened from 40%-50% to 11%. While on the rise since August, BTC’s correlation with gold averaged just 12% this year. Typically, a correlation in the range of a negative 20% to a positive 20% means that the asset is mostly uncorrelated.
Kaiko's research newsletter is written by the Kaiko research team: Clara Medalie, Dessislava Aubert, and Riyad Carey.This content is the property of Kaiko, its affiliates and licensors. Any use, reproduction or distribution is permitted only if ownership and source are expressly attributed to Kaiko. This content is for informational purposes only, does not constitute investment advice, and is not intended as an offer or solicitation for the purchase or sale of any financial instrument. For any questions, please email research@kaiko.com.
Click here to learn about Kaiko’s full suite of professional cryptocurrency data services.

%20(5).png?upscale=true&width=1100&upscale=true&name=Big_newsletter_banner%20(650%20%C3%97%20350px)%20(5).png)

-2.png?upscale=true&width=1100&upscale=true&name=image%20(12)-2.png)
-1.png?upscale=true&width=1100&upscale=true&name=image%20(13)-1.png)


-Nov-06-2023-09-33-16-7786-AM.png?upscale=true&width=1100&upscale=true&name=image%20(14)-Nov-06-2023-09-33-16-7786-AM.png)